Total 60 Questions
Last Updated On : 29-Jun-2026
Preparing with Marketing-Cloud-Intelligence practice test 2026 is essential to ensure success on the exam. It allows you to familiarize yourself with the Marketing-Cloud-Intelligence exam questions format and identify your strengths and weaknesses. By practicing thoroughly, you can maximize your chances of passing the Salesforce certification 2026 exam on your first attempt. Start with free Marketing Cloud Intelligence Accredited Professional - AP-215 sample questions or use the timed simulator for full exam practice. Surveys from different platforms and user-reported pass rates suggest Marketing Cloud Intelligence Accredited Professional - AP-215 practice exam users are ~30-40% more likely to pass.

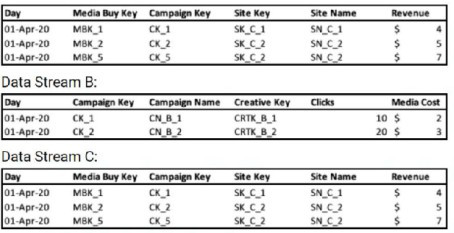
A client provides the following three files:

Which proposed solution would cause a false connection between the two files?
A. Custom classification
B. Data Classification
C. VLOOKUP in Data Stream B. Vlookup will return “Day” and “Installs”
D. VLOOKUP in Data Stream C. Vlookup will return "MB Name”
📊 Explanation
This question tests understanding of proper data integration in Marketing Cloud Intelligence. File B is a simple mapping table (MB Name → MB New Name) designed only for renaming purposes. The key is identifying which solution incorrectly transforms this reference table by pulling transactional data into it, creating false connections and corrupting the data model.
✅ Correct Option: C. VLOOKUP in Data Stream B. Vlookup will return "Day" and "Installs"
File B is a pure mapping table with no temporal or metric data. Using VLOOKUP to pull "Day" and "Installs" from File C into File B incorrectly transforms it into a transactional table. This creates false connections by forcing time-series data into a dimension-only structure, causing data duplication, misattribution, and breaking the intended architecture where File B should only translate names.
❌ Incorrect Options:
A. Custom classification
Custom classification applies manual rules for entity categorization without merging transactional data into reference tables. It maintains file boundaries and respects each file's purpose, allowing proper categorization across all three files without corrupting File B's structure as a simple lookup table.
B. Data Classification
Data Classification uses rule-based categorization to organize entities but doesn't force transactional data into reference tables. It helps standardize groupings without violating data architecture principles, maintaining File B's integrity as a mapping-only table while properly categorizing media buys.
D. VLOOKUP in Data Stream C. Vlookup will return "MB Name"
This correctly enriches File C by retrieving original "MB Name" from File B based on "MB New Name". This respects proper data flow where mapping tables enrich transactional data (not vice versa), maintaining referential integrity and creating valid connections for reporting.
💡 Summary
VLOOKUP in File B returning transactional data (Day and Installs) creates false connections by incorrectly pulling time-series data into a reference mapping table, violating data modeling principles.
📚 Reference
Salesforce Marketing Cloud Intelligence VLOOKUP and Data Enrichment:
Proper techniques for enriching data streams while maintaining correct data architecture and table relationships.
Marketing Cloud Intelligence Data Stream Best Practices:
Understanding reference tables versus transactional tables for proper data model integrity.
Which two statements are correct regarding variable Dimensions in marketing Cloud intelligence’s data model?
A. These dimensions are stored at the workspace level
B. Variable Dimensions hold a Many-to-Many relationship with its main entity
C. All variables exist in every data set type, hence are considered as overarching dimensions
D. These are stand alone dimensions that pertain to the data set itself rather than to a specific entity
Explanation
In Marketing Cloud Intelligence, Variable Dimensions (frequently referred to as Standalone Dimensions or Dataset Dimensions) are flexible attributes that belong directly to a specific data stream/dataset rather than being embedded within the main hierarchical entities (such as Advertiser → Brand → Campaign → Ad). They act as additional context — like Device Category, Operating System, Browser, Country, or Platform — allowing analysts to slice and filter data broadly across the entire dataset without depending on the rigid entity structure. This makes them extremely useful for cross-entity analysis.
Correct Options:
B. Variable Dimensions hold a Many-to-Many relationship with its main entity
✅ Correct. Since Variable Dimensions are not locked to one specific entity in the model hierarchy, a single variable value (e.g., “iOS” as Operating System) can connect to many different entity records (multiple campaigns, ads, placements), and conversely, one entity record can be associated with multiple variable values. This many-to-many cardinality is a core characteristic that enables flexible, multi-dimensional reporting.
D. These are stand alone dimensions that pertain to the data set itself rather than to a specific entity
✅ Correct. Variable Dimensions are scoped at the data stream level — they are attributes of the incoming dataset as a whole, not children or properties of any particular entity like Campaign, Site, or Placement. That standalone nature is precisely what distinguishes them from regular entity-attached dimensions.
Incorrect Options:
A. These dimensions are stored at the workspace level
❌ Incorrect. The workspace is the top-level container that holds multiple data streams, classifications, measurement rules, user permissions, and global settings. Variable Dimensions, however, are created, mapped, and stored inside individual data streams, not at the workspace level itself.
C. All variables exist in every data set type, hence are considered as overarching dimensions
❌ Incorrect. While Variable Dimensions are “overarching” in the sense that they apply across the dataset (not just one entity), they are not guaranteed to exist in every data stream or dataset type. Their presence depends entirely on what fields the source provides and how they are mapped during data ingestion — different connectors and streams can have very different sets of Variable Dimensions.
Summary
Variable Dimensions are powerful, dataset-scoped attributes in Marketing Cloud Intelligence that exist independently of the main entity hierarchy. Their key strengths are the many-to-many relationship with entities (option B) and their standalone placement at the data stream level rather than being tied to a specific entity (option D). This design supports flexible, cross-cutting analysis without forcing rigid parent-child structures.
Reference
Salesforce Help: Understanding the Marketing Cloud Intelligence Data Model
Salesforce Help: Dimensions in Marketing Cloud Intelligence
Salesforce Help: Data Streams and Dataset-Level Dimensions (describes standalone / variable dimension behavior at dataset level)
A client wants to integrate their data within Marketing Cloud Intelligence to optimize their marketing insights and cross-channel marketing activity analysis. Below are details regarding the different data sources and the number of data streams required for each source.
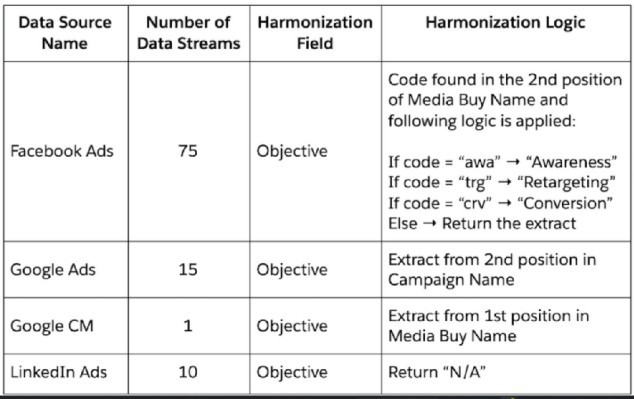
When harmonizing the Objective field from within the data stream mapping, which advantage is gained?
A. Scalability
B. Ease of Setup
C. Performance (Performance when loading a dashboard page)
D. Ease of Maintenance
Explanation
Harmonizing the Objective field centrally (via mapping patterns or calculated logic) puts complex extraction + mapping rules in one place. This makes updates quick and consistent across many data streams — especially helpful with 75 Facebook streams — reducing manual work and errors over time.
Correct Option
D. Ease of Maintenance ✅
Centralized harmonization logic means any change (new code, updated mapping, different position) is edited once instead of touching every stream. This saves significant time and keeps data clean when maintaining high-volume sources like Facebook Ads or adding new campaigns.
Incorrect Options
A. Scalability ❌
The setup helps consistency as you grow, but it doesn’t directly improve the system’s ability to handle much larger data volumes or many more sources — that comes more from the platform architecture and connectors.
B. Ease of Setup ❌
Building position-based extraction + conditional mapping (e.g., "trg" → "Retargeting") takes planning and testing. It’s more advanced than simple field mapping, so initial setup is actually harder, not easier.
C. Performance (Performance when loading a dashboard page) ❌
This harmonization runs during data processing, not at query/dashboard load time. It has little to no impact on how fast dashboards render — performance gains come from aggregations, filters, or data model design.
Summary
Central harmonization of Objective delivers the biggest win in maintenance.
One change applies everywhere — perfect for many streams and evolving campaign naming rules.
It keeps your data model reliable and easy to govern long-term.
Reference
Salesforce Trailhead: Benefits of Data Model & Harmonization and Data Harmonization in Marketing Cloud Intelligence — both highlight how centralized patterns and harmonized dimensions simplify governance and ongoing changes.
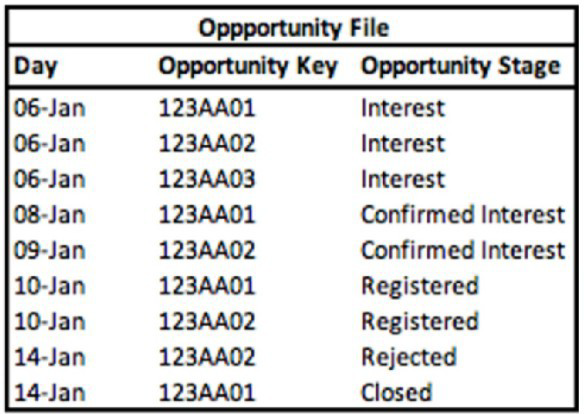
A technical architect is provided with the logic and Opportunity file shown below:
The opportunity status logic is as follows:
For the opportunity stages “Interest”, “Confirmed Interest” and “Registered”, the status should be “Open”.
For the opportunity stage “Closed”, the opportunity status should be closed Otherwise, return null for the opportunity status.
Given the above file and logic and assuming that the file is mapped in a generic data stream type with the following mapping
“Day” — Standard “Day” field
“Opportunity Key” > Main Generic Entity Key
“Opportunity Stage” + Generic Entity Key 2
A pivot table was created to present the count of opportunities in each stage. The pivot table is filtered on Jan 7th - 11th. Which option reflects the stage(s) the Opportunity key 123AA01 is associated with?
A. Registered
B. Interest & Registered
C. Confirmed Interest & Registered
D. Interest
E. Confirmed Interest
Explanation:
The filter (Jan 7th-11th) selects only the rows where the Day falls within that date range. We must look at all stages for Opportunity 123AA01 that occurred on those specific days.
Analysis of 123AA01 within Date Filter (Jan 7-11):
Jan 8: 123AA01 → Stage: Confirmed Interest
Jan 10: 123AA01 → Stage: Registered
No other entries for 123AA01 exist on Jan 7, 9, or 11.
✅ Correct Option:
C. Confirmed Interest & Registered.
This is correct because within the filtered date range of January 7th to 11th, the Opportunity Key 123AA01 has two relevant records: one on Jan 8th with the stage "Confirmed Interest" and one on Jan 10th with the stage "Registered."
❌ Incorrect Option:
A. Registered.
This is incomplete, as it misses the "Confirmed Interest" stage that also occurred within the date filter.
B. Interest & Registered.
"Interest" for this key occurred on Jan 6, which is outside the filtered date range.
D. Interest.
The "Interest" stage for this key (Jan 6) is excluded by the date filter.
E. Confirmed Interest.
This is incomplete, as it misses the "Registered" stage that also occurred within the date filter.
Summary:
When applying the date filter of January 7-11, only the stages that occurred on those specific dates for Opportunity 123AA01 are included. This results in two stages: Confirmed Interest (Jan 8) and Registered (Jan 10).
Reference:
Marketing Cloud Intelligence Help: "Working with Filters in Stories"
Ina workspace that contains one hundred data streams and a lot of data, what is the biggest downside of using calculated dimensions?
A. Performance
B. Ease of setup
C. Ease of maintenance
D. Scalability
Explanation
Calculated dimensions require real-time computation across all data streams during every query execution, creating heavy processing demands in large workspaces. With 100+ streams, this dynamic recalculation slows dashboard loading, widget rendering, and report generation significantly. While flexible for custom logic, the performance hit becomes the primary limitation in high-volume environments.
Correct Option: A ✅
Performance stands out as the critical drawback in workspaces with massive data volumes across numerous streams. Each widget refresh triggers full recalculations, taxing system resources and delaying results. This computational overhead compounds with dataset size, making charts and filters noticeably sluggish compared to native dimensions.
Incorrect Option: B ❌
Ease of setup actually favors calculated dimensions—they're created via simple formula builders without data restructuring or re-uploads. Users define logic once through intuitive interfaces, gaining flexibility far beyond predefined fields. The initial configuration proves straightforward even for complex business rules.
Incorrect Option: C ❌
Maintenance remains manageable since formulas live centrally and apply workspace-wide without per-stream edits. Updates propagate automatically across all using widgets, unlike scattered lookup tables or data load rules. Version control and testing stay contained to the calculation definition itself.
Incorrect Option: D ❌
Scalability concerns stem primarily from performance impacts rather than architectural limits. The platform handles calculated dimensions across large deployments, but execution speed degrades with volume—not fundamental scaling barriers. Optimization techniques like data reimmersion help mitigate these effects.
Summary
Performance degradation dominates as calculated dimensions recalculate dynamically across 100+ streams.
Setup and maintenance prove user-friendly through centralized formula management.
Best reserved for targeted use cases rather than broad workspace reliance.
Reference
Salesforce Help: Data Reimmersion
Salesforce Help: Calculated Dimensions
What are unstable measurements?
A. Measurements for which Aggregation Settings are set as ‘Auto’ and Granularity is set as ‘None’.
B. Measurements that are set with the LIFETIME aggregation function
C. Measurements for which Aggregation Settings are set as ‘Not Auto’ and Granularity is set as ‘None’.
D. Measurements for which Aggregation Settings are set as ‘Not Auto’ and Granularity is set as ‘Not Empty’.
Explanation:
In Salesforce Marketing Cloud Intelligence, a measurement is considered unstable when:
Aggregation Settings are set to Not Auto (i.e., manual aggregation is applied),
Granularity is set to None, meaning the measurement lacks a defined time-based or entity-based grouping.
This combination causes instability because the platform cannot reliably determine how to aggregate the data across time or entities, leading to inconsistent or misleading results in dashboards and widgets.
🔍 Why the Other Options Are Incorrect:
A. Auto + None
Auto aggregation compensates for missing granularity, so the measurement remains stable.
B. LIFETIME aggregation
LIFETIME is a valid aggregation type and does not inherently cause instability.
D. Not Auto + Not Empty
This is actually a stable configuration — manual aggregation with defined granularity is acceptable.
📘 Reference:
You can find more on this in the Salesforce Help documentation on MDP Granularity in Calculated Measurements
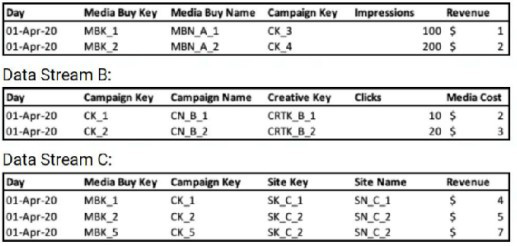
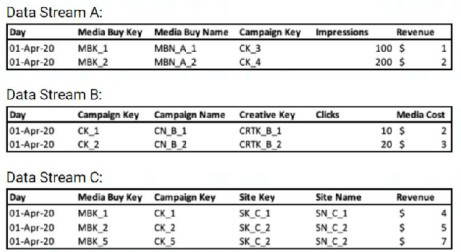
A client's data consists of three data streams as follows:
Data Stream A:
 <
<
The data streams should be linked together through a parent-child relationship.
Out of the three data streams, Data Stream C is considered the source of truth for both the dimensions and measurements.
The client would like to have a "Site Revenue" measurement.
This measurement should return the highest revenue value per Site, for example: For Site Key ‘SK_C_2’, the "Site Revenue" should be $7.00.
When aggregated by date, the "Site Revenue" measurement should return the total sum of the results of all sites.
For example:
For the date 1 Apr 2020, "Site Revenue" should be $11.00 (sum of Site Revenue for Site Keys ‘SK_C_1' ($4.00) and ‘SK_C_2’ ($7.00))
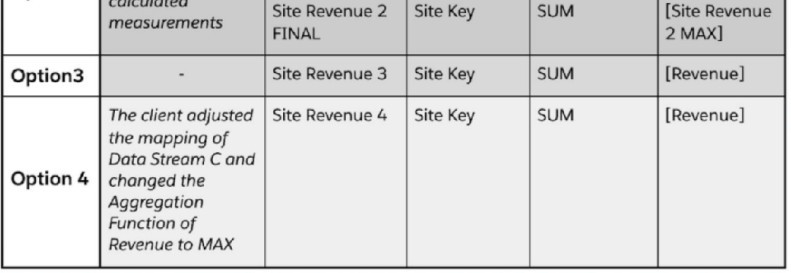
Which options will yield the desired result;
A. Option #1 & Option #4
B. Option #1 & Option #3
C. Option #2 & Option #3
D. Option #2 & Option #4
Explanation:
This tests advanced understanding of aggregation functions and the order of operations in Datorama's metric builder. The requirement has two parts: first, find the MAX revenue per Site Key within Data Stream C, and then SUM those maximum values when grouped by a higher level like Day.
✅ Correct Option: D (Option #2 & Option #4)
Option #2 correctly uses a two-step aggregation: first MAX([Revenue]) grouped by [Site Key] to create an intermediate metric [Site Revenue 2 MAX], then SUM([Site Revenue 2 MAX]) to total the per-site maximums. This follows the required logic.
Option #4 states the client changed the aggregation of the source Revenue field in Data Stream C to MAX. If the source field itself is pre-aggregated as MAX, then a simple SUM([Revenue]) in the metric would effectively sum the already-maximized values, also achieving the goal.
❌ Incorrect Option: A (Option #1 & Option #4)
Option #1 only performs a single SUM([Revenue]) directly. This would sum all raw revenue rows (e.g., $4 + $5 + $7 for SK_C_2 = $16), not the maximum value per site ($7), thus failing the first requirement.
❌ Incorrect Option: B (Option #1 & Option #3)
Option #1 fails as explained. Option #3 creates a metric Site Revenue 3 that is a simple SUM([Revenue]). This is identical to Option #1 in function and does not incorporate the necessary MAX per-site logic.
❌ Incorrect Option: C (Option #2 & Option #3)
While Option #2 is correct, Option #3 is not. Using Site Revenue 3 (a simple SUM) would not yield the correct result because it doesn't reference the correctly built intermediate metric ([Site Revenue 2 MAX]) that holds the per-site maximums.
📘 Summary:
The solution requires isolating the maximum revenue per site before summing. This can be achieved either by building a metric with a nested MAX-then-SUM aggregation (Option #2) or by changing the source data's aggregation to MAX and then summing it (Option #4). Simple SUM metrics on the raw data fail the requirement.
🔗 Reference:
Marketing Cloud Intelligence Help: "Build Advanced Metrics with Aggregation Functions" and "Understand Data Aggregation in Streams."
A client's data consists of three data streams as follows:
Data Stream A:
* The data streams should be linked together through a parent-child relationship.
* Out of the three data streams, Data Stream C is considered the source of truth for both the dimensions and measurements.
How should the "Override Media Buy Hierarchies” checkbox be set in order to meet the client's requirements?
A. It should be checked in Data Stream C
B. It should not be checked in any of the three Data Streams.
C. It should be checked in Data Stream B
D. It should be checked in Data Stream A
Explanation:
The client has two key requirements:
Data Stream C is the source of truth for both dimensions and measurements.
The data streams should be linked through a parent-child relationship.
The "Override Media Buy Hierarchies" checkbox is a powerful setting that dictates which data stream provides the authoritative definition of the Media Buy hierarchy (i.e., the relationship between Media Buy Key, Campaign Key, and other related dimensions).
Why A is Correct:
By checking "Override Media Buy Hierarchies" in Data Stream C, you are explicitly telling the platform to use the dimensions (like Media Buy Key, Campaign Key, Site Key, Site Name) from Data Stream C as the master definitions for the entire data model. This ensures that the hierarchical structure and dimension values from the designated "source of truth" are used to organize and link the data from all other streams (A and B). This action fulfills both requirements: it establishes C as the source of truth and is the necessary step to correctly form the parent-child relationships based on that truth.
Why the Other Options are Incorrect:
B. It should not be checked in any of the three Data Streams:
If this box is not checked in any stream, the platform will not know which stream to use as the master for the Media Buy hierarchy. This would likely lead to a default behavior that does not respect the requirement that Data Stream C is the source of truth, potentially causing data duplication or misalignment.
C. It should be checked in Data Stream B:
Data Stream B is not the source of truth. It contains different dimensions (Creative Key, Campaign Name) and lacks the Site Key and Site Name dimensions present in A and C. Making B the hierarchy master would ignore the client's explicit requirement and result in an incorrect data model.
D. It should be checked in Data Stream A:
While Data Stream A has the same structure as C, the client has specifically stated that Data Stream C is the source of truth. Therefore, C must be chosen as the master hierarchy stream to ensure consistency and accuracy.
Reference:
This aligns with the MCI data modeling principle of using a single, authoritative source for dimensions to build accurate and non-duplicative relationships across multiple data streams. The "Override" checkbox is the primary tool for defining this authoritative source.
A client's data consists of three data streams as follows:
* The data streams should be linked together through a parent-child relationship.
* Out of the three data streams, Data Stream C is considered the source of truth for both the dimensions and measurements.
* Data Stream C was set as a ‘Parent’, and the ‘Override Media Buy Hierarchy’ checkbox is checked
What should the Data Updates Permissions be set to for Data Stream B?
A. There is no difference, all permissions will have a similar effect given the scenario.
B. Update Attributes and Hierarchies
C. Update Attributes
D. Inherit Attributes and Hierarchies
Explanation
In this setup, Data Stream C acts as the parent with 'Override Media Buy Hierarchy' enabled, making it the source of truth for dimensions and metrics. Child streams like Data Stream B should inherit from the parent to align hierarchies and attributes without overriding them. Setting permissions to 'Inherit Attributes and Hierarchies' ensures Data Stream B pulls updates from C, preventing conflicts while maintaining consistency across streams.
Correct Option
✅ D. Inherit Attributes and Hierarchies
This option fits perfectly since C is the parent and source of truth. It directs B to adopt C's attributes and hierarchy structure during ingestion, ensuring unified media buy, campaign, and other dimensions. No overrides occur, keeping C in control as intended.
Incorrect Options
❌ A. There is no difference, all permissions will have a similar effect given the scenario.
Permissions vary significantly: 'Update Attributes' refreshes only attributes, 'Update Attributes and Hierarchy' alters both but requires override unchecked (not possible here), and 'Inherit' pulls from parent. They produce different outcomes based on parent-child dynamics.
❌ B. Update Attributes and Hierarchies
This would attempt to push B's attributes and hierarchy to the parent pool, but with C's override checked, it's incompatible and unavailable. It contradicts C being the sole source of truth, risking hierarchy mismatches.
❌ C. Update Attributes
This updates only attributes from B into the shared pool, ignoring full hierarchy inheritance needed here. Since C dictates hierarchy via override, B shouldn't update anything—inheritance maintains alignment without partial changes.
Summary
Parent C with override controls the hierarchy; B as child must inherit to follow suit. Other permissions either conflict or partially update, breaking the source-of-truth rule. Use inheritance for clean, dependent data flow.
Reference:
Salesforce Help - Parent-Child Connections in Marketing Cloud Intelligence
A client has integrated data from Facebook Ads. Twitter ads, and Google ads in marketing Cloud intelligence. For each data source, the source, the data follows a naming convensions as …
Facebook Ads Naming Convention - Campaign Name:
CampID_CampName#Market_Object#object#targetAge_TargetGender Twitter Ads Naming Convention- Media Buy Name MarketTargeAgeObjectiveOrderID
Google ads Naming Convention-Media Buy Name: Buying_type_Market_Objective
The client wants to harmonize their data on the common fields between these two platforms (i.e. Market and Objective) using the Harmonization Center. Given the above information, which statement is correct regarding the ability to implement this request?
wet Me - Given the above information, which statement i 's Correct regarding the ability to implement this request?
A. The clientWi-Fibe able to harmonize only Google Ads and Twitter Ads, as Facebook Ads naming convention contains mufti delimiters.
B. it is not possible to do this, as the naming conventions are different
C. This is not possible as the naming conventions are in different fields (Campaign Name and Placement Name)
D. The client will be able to do this and it will require building three patterns.
Explanation
Marketing Cloud Intelligence's Harmonization Center excels at unifying fields across data streams with varying naming conventions and delimiters. Here, Facebook Ads uses Campaign Name with "#", Twitter and Google use Media Buy Name with "_". Building one pattern per data source extracts Market and Objective consistently, enabling seamless harmonization despite field and delimiter differences.
Correct Option ✅ D
The client can fully harmonize Market and Objective fields using three dedicated patterns—one for Facebook Ads Campaign Name (handling "##" positions), one for Twitter Ads Media Buy Name (positions 1-2), and one for Google Ads Media Buy Name (positions 2-3). This multi-pattern approach standardizes extractions across all streams into common harmonized dimensions.
Incorrect Option ❌ A
Facebook Ads' multiple delimiters ("#", "_") do not block harmonization; the Pattern builder supports mixed delimiters by letting you specify exact positions and separators per pattern. A single pattern can parse CampID_CampName#Market_Object#object#targetAge_TargetGender to reliably extract Market (position 3 after "#") and Objective (position 4), just like the others.
Incorrect Option ❌ B
Different naming conventions are exactly what Patterns are designed to overcome—they extract structured values from varied formats/delimiters into unified fields. Without this capability, multi-platform integration would be impossible. The Harmonization Center bridges these differences precisely for scenarios like Facebook, Twitter, and Google Ads coexistence.
Incorrect Option ❌ C
Field names like Campaign Name vs. Media Buy Name are irrelevant; Patterns target specific data streams and fields independently, mapping extractions to shared harmonized dimensions (e.g., Market, Objective). You select the source field per pattern during setup, so the system unifies regardless of original field labels across streams.
Summary
Three patterns—one per platform—parse the unique naming conventions to extract Market and Objective. This works despite varying fields (Campaign/Media Buy Name) and delimiters ("#"_"). Harmonization Center unifies them perfectly for cross-platform reporting.
Reference:
Salesforce Help - Harmonization Center, Trailhead Data Harmonization Modules
| Page 1 out of 6 Pages |
| 12 |
Our new timed 2026 Marketing-Cloud-Intelligence practice test mirrors the exact format, number of questions, and time limit of the official exam.
The #1 challenge isn't just knowing the material; it's managing the clock. Our new simulation builds your speed and stamina.
You've studied the concepts. You've learned the material. But are you truly prepared for the pressure of the real Marketing Cloud Intelligence Accredited Professional - AP-215 exam?
We've launched a brand-new, timed Marketing-Cloud-Intelligence practice exam that perfectly mirrors the official exam:
✅ Same Number of Questions
✅ Same Time Limit
✅ Same Exam Feel
✅ Unique Exam Every Time
This isn't just another Marketing-Cloud-Intelligence practice questions bank. It's your ultimate preparation engine.
Enroll now and gain the unbeatable advantage of:
Copyright © - All Rights Reserved