Free Salesforce Tableau Desktop Foundations Practice Test Questions
Topic: Exploring and Analyzing Data
38 questionsUpdated 13-Nov-20264 topics
TopicExploring and Analyzing Data
Question 1Choose 1
Which aggregation is available without requiring a table calculation or calculated field?
Correct answer:
C. Standard deviation
Explanation:
In Tableau, aggregations like Standard Deviation are built-in aggregation functions that can be applied directly to a measure field from the Data pane, without needing to write a calculated field or apply a table calculation. You can simply drag a measure to the view and select "Standard Deviation" from the Measure menu (or the Analysis > Aggregation menu) to use it immediately.
Correct Option:
Option C: Standard deviation –
Tableau provides built-in aggregation options including Sum, Average, Median, Count, Minimum, Maximum, Standard Deviation, and Variance. These are available directly on any measure field without requiring any additional calculation steps.
Incorrect Options:
Option A: Running total –
A running total is a table calculation, not a standard aggregation. It must be applied explicitly via the Quick Table Calculation menu or by creating a calculated field using RUNNING_SUM().
Option B: Sample covariance –
Sample covariance is not a built-in aggregation in Tableau. It would require creating a calculated field using statistical functions, or applying a table calculation, to compute.
Option D: Percent of total –
Percent of total is a table calculation that transforms values relative to the total. It is applied via Quick Table Calculation or the Analysis > Percentages Of menu, not available as a direct aggregation.
Reference:
Tableau Help – Summary Card (Standard Deviation definition) ; Tableau Help – Quick Table Calculations ; Tableau Help – Table Calculation Types
Question 2Choose 2
Which two filter modes can a Tableau associate use with dimension filters?
Correct answer:
A. Multiple Values (drop-down)
C. Wildcard Match
Explanation:
Tableau offers several filter card modes for dimension filters, but they fall into distinct categories. Multiple Values and Wildcard Match are both standard dimension filter modes that control how users select or search for values in the filter card .
Correct Options:
A. Multiple Values (drop-down) –
This mode displays filter values in a drop-down list where users can select multiple checkboxes at once. It is one of the standard dimension filter card modes in Tableau .
C. Wildcard Match –
This mode provides a text box where users type characters (using * as a wildcard) to match and select values automatically, such as "tab*" to select all values starting with "tab" .
Incorrect Options:
B. Range of Values –
This is a measure filter mode, not a dimension filter mode. It displays values as a pair of sliders for selecting a numeric range, applicable only to measures .
D. At most –
This is a quantitative filter option for measures, allowing filtering on aggregated values (e.g., values ≤ a threshold). It is not a dimension filter card mode .
Reference:
Tableau Help – Filter Card Modes for Dimensions ; Tableau Filtering Documentation – Dimension vs. Measure Filters
Question 3Choose 3
From which three locations can a Tableau associate sort a visualization?
Choose three options.
Correct answer:
A. A header
C. An axis
D. A field label
Explanation:
Tableau allows users to sort data directly from the visualization through interactive elements. According to official Tableau documentation, single-click sorting options are available from an axis, a header, or a field label . These three locations provide quick access to sorting without navigating menus.
Correct Options:
A. A header –
Hovering over a header reveals a sort icon. Clicking it cycles through descending, ascending, and clearing the sort. The sort applies to the dimension values within that header .
C. An axis –
Hovering over a numerical axis displays a sort icon. This sorts the marks based on the measure values on that axis, applying to the innermost dimension when hierarchies are present .
D. A field label –
Field labels also provide a sort icon with alphabetical sorting as the default option, plus a menu to sort by other fields in the view .
Incorrect Options:
B. Tooltip on the Marks card –
Tooltips are for displaying additional information when hovering over marks. They do not provide sorting functionality .
E. The Worksheet menu –
While the Worksheet menu contains options like "Show Sort Controls," it is not a direct location to perform sorting. Sorting actions occur on the visualization elements themselves .
F. The Analysis menu –
The Analysis menu provides options for table calculations, totals, and forecasting. It does not serve as a direct sorting location for visualization elements .
Reference:
Tableau Help – Sort Data in a Visualization ("Quickly sort from an axis, header, or field label")
Question 4Choose 1
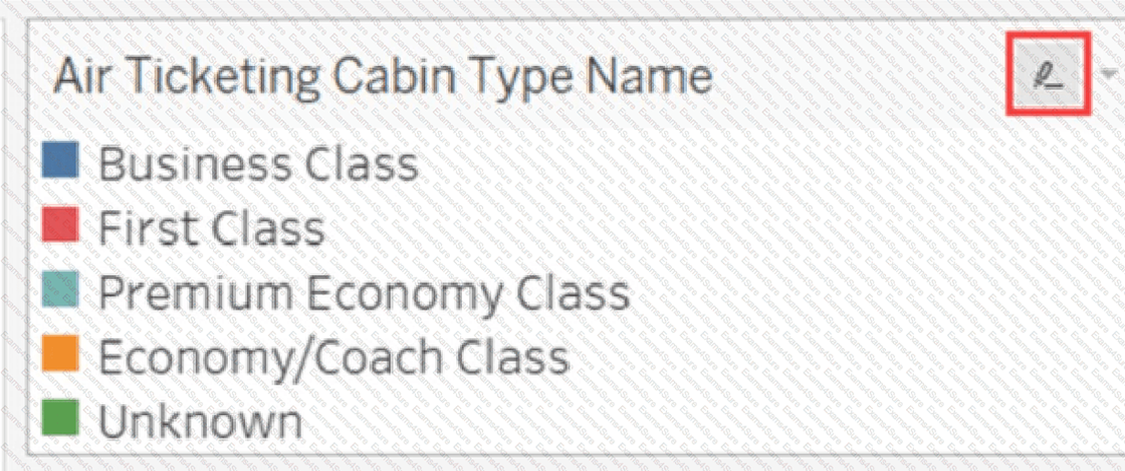
A Tableau associate has the following legend.
What occurs when the associate clicks the icon to the right of Air Ticketing Cabin Type Name?
Correct answer:
C. The highlighter toggles on or off.
Explanation:
The icon to the right of a legend item in Tableau is the highlight button. Clicking this icon toggles the highlighter on or off for that legend field. When activated, selecting a legend item will highlight the corresponding marks in the view while dimming all others, drawing focus to specific data points .
Correct Option:
C. The highlighter toggles on or off –
This is the correct answer. The highlight icon appears when you hover over a legend. Clicking it enables highlight mode, allowing you to click legend entries to spotlight matching marks. Clicking the icon again disables the highlighting action entirely .
Incorrect Options:
A. The Edit Colors dialog box opens –
The Edit Colors dialog is accessed by right-clicking a field or using the Edit Colors option from the legend's dropdown menu. It is not triggered by the highlight icon .
B. The filter options open –
Filter options are accessed through the filter card or by right-clicking a field and selecting "Show Filter." The highlight icon does not control filtering .
D. The legend toggles on or off –
The legend itself is hidden or shown via the Worksheet menu (Show/Hide Cards) or by right-clicking the legend and selecting "Hide Card." The highlight icon does not hide or show the legend .
Our timed 2026 Salesforce Tableau Desktop Foundations practice test mirrors the format, number of questions and time limit of the official exam.
The #1 challenge isn't just knowing the material, it's managing the clock. The simulation builds your speed and stamina, so you walk in knowing exactly what to expect.