Free Salesforce Tableau Desktop Foundations Practice Test Questions
38 questionsUpdated 13-Nov-20264 topics
Preparing with this Salesforce Tableau Desktop Foundations practice test is essential to ensure success on the exam. It lets you get familiar with the Salesforce Tableau Desktop Foundations question format and identify your strengths and weaknesses, so you can maximise your chances of passing the Salesforce certification exam on your first attempt. Start with the free Salesforce Tableau Desktop Foundations - Analytics-101 sample questions below, or use the timed simulator for full exam practice.
Surveys from different platforms and user-reported pass rates suggest Salesforce Tableau Desktop Foundations - Analytics-101 practice exam users are ~30-40% more likely to pass.
TopicConnecting to and Preparing Data
Question 1Choose 1
A Tableau associate needs to display the complete list of potential data connections when connecting to a server.
Which action should the associate perform?
Correct answer:
D. Select More under To a Server.
Explanation:
When connecting to data in Tableau Desktop, the start page displays commonly used connectors. To view the complete list of available server-based data connections, the associate must click "More" under the "To a Server" section. This expands the full list of supported server connectors, such as Microsoft SQL Server, Oracle, PostgreSQL, Snowflake, and others.
Correct Option:
Select More under To a Server:
This reveals the full list of server data sources Tableau Desktop can connect to. The start page only shows a few popular connectors by default, so clicking "More" expands the complete list of supported server connections.
Incorrect Option:
Select Connecting to Data:
This is a general category/heading on the start page, not an actionable link that expands server connection options.
Select File on the menu, and then select New:
This creates a new workbook, not a new data connection, and does not display the list of server connectors.
Select More under To a File:
This expands file-based connectors (Excel, CSV, JSON, PDF, etc.), not server connections.
Reference: Tableau Desktop Help — "Connect to Data" / Tableau Desktop and Web Authoring Help: Connect to a Server.
Question 2Choose 1
When should a Tableau associate use a relationship instead of a join for two data sets?
Correct answer:
D. The data sets include similar data aggregated at different levels of detail.
Explanation:
A Tableau relationship should be used when datasets contain similar data aggregated at different levels of detail. Unlike joins, which merge tables into a single flat structure and can duplicate aggregate values, relationships preserve each table's native level of detail . This makes relationships ideal for analyzing measures that exist at different granularities without requiring complex Level of Detail (LOD) calculations .
Correct Option:
Option D: The data sets include similar data aggregated at different levels of detail.
Relationships maintain the original granularity of each table and automatically handle aggregation context based on the fields used in the visualization . Tableau performs context-based joins behind the scenes, preventing duplication of aggregated values and preserving unmatched records .
Incorrect Options:
Option A: To use both data sets across multiple sheets in a visualization.
Both relationships and joins allow using data across multiple sheets. This is not a distinguishing factor for choosing relationships over joins .
Option B: The data sets are in two separate tables within a single spreadsheet.
The physical location of tables (same spreadsheet or different sources) does not determine whether to use relationships or joins. Both methods can combine tables from the same spreadsheet .
Option C: The data sets include similar data aggregated up to the highest level.
When data is already aggregated to the same level, a join may suffice. Relationships are specifically valuable when levels of detail differ between tables .
Reference:
Tableau Help – Relate Your Data (Relationships vs Joins) ; Tableau Help – How Relationships Differ from Joins
TopicSharing Insights
Question 3Choose 3
Which three elements are included in a packaged workbook (.twbx)?
Correct answer:
A. Background images
B. Custom shapes
E. Extract files
Explanation:
A packaged workbook (.twbx) is essentially a zip archive that bundles the workbook (.twb) together with all resources required to open it independently . This includes local file data sources (such as extracts), background images, and custom shapes, ensuring the visualization can be shared with users who lack access to the original data connections .
Correct Options:
Option A: Background images –
Packaged workbooks include a copy of any background images used in the dashboard, ensuring the visualization renders correctly on other machines .
Option B: Custom shapes –
Any custom shape palettes added to a workbook are embedded within the .twbx package so that marks display properly when shared .
Option E: Extract files –
When non-file-based data sources are used, extracts (.hyper or .tde) are created and bundled inside the .twbx to provide a portable snapshot of the data .
Incorrect Options:
A PDF copy of the workbook –
A .twbx package does not contain a PDF version of the workbook. PDF is a separate export format, not an embedded component .
Tableau Datasource Customization (TDC) files – TDC files are not included in packaged workbooks. They are separate configuration files used to customize connection behavior and are not bundled into .twbx archives .
Reference:
Tableau Help – Packaged Workbooks ; Tableau File Types and Folders ; Tableau Help – Save Packaged Workbooks
TopicUnderstanding Tableau Concepts
Question 4Choose 2
What are two outcomes when a Tableau associate drags a continuous date value to the Rows shelf?
Correct answer:
B. The pill on the Rows shelf is green
C. A quantitative axis is shown.
Explanation:
In Tableau, a continuous date is treated as a continuous field, which is visually represented by a green pill. When placed on the Rows shelf, it produces a quantitative axis (a continuous timeline) rather than discrete headers. This behavior contrasts with a discrete date, which creates blue pills and labels.
Correct Options:
B. The pill on the Rows shelf is green.
Continuous fields are always indicated by green pills in Tableau, regardless of whether they are dimensions or measures.
C. A quantitative axis is shown.
Continuous fields create axes with a continuous numerical scale, which is essential for visualizing trends over time.
Incorrect Options:
A. The date part is displayed as labels.
Displaying date parts as labels (headers) is characteristic of discrete dates, which appear as blue pills, not continuous dates.
D. The pill on the Rows shelf is blue.
Blue pills represent discrete fields. Since the question specifies a continuous date, the pill must be green.
Reference:
Tableau Help – Dimensions and Measures, Blue and Green ; Tableau Help – Convert Fields Between Discrete and Continuous
TopicExploring and Analyzing Data
Question 5Choose 1
Which aggregation is available without requiring a table calculation or calculated field?
Correct answer:
C. Standard deviation
Explanation:
In Tableau, aggregations like Standard Deviation are built-in aggregation functions that can be applied directly to a measure field from the Data pane, without needing to write a calculated field or apply a table calculation. You can simply drag a measure to the view and select "Standard Deviation" from the Measure menu (or the Analysis > Aggregation menu) to use it immediately.
Correct Option:
Option C: Standard deviation –
Tableau provides built-in aggregation options including Sum, Average, Median, Count, Minimum, Maximum, Standard Deviation, and Variance. These are available directly on any measure field without requiring any additional calculation steps.
Incorrect Options:
Option A: Running total –
A running total is a table calculation, not a standard aggregation. It must be applied explicitly via the Quick Table Calculation menu or by creating a calculated field using RUNNING_SUM().
Option B: Sample covariance –
Sample covariance is not a built-in aggregation in Tableau. It would require creating a calculated field using statistical functions, or applying a table calculation, to compute.
Option D: Percent of total –
Percent of total is a table calculation that transforms values relative to the total. It is applied via Quick Table Calculation or the Analysis > Percentages Of menu, not available as a direct aggregation.
Reference:
Tableau Help – Summary Card (Standard Deviation definition) ; Tableau Help – Quick Table Calculations ; Tableau Help – Table Calculation Types
Question 6Choose 2
Which two filter modes can a Tableau associate use with dimension filters?
Correct answer:
A. Multiple Values (drop-down)
C. Wildcard Match
Explanation:
Tableau offers several filter card modes for dimension filters, but they fall into distinct categories. Multiple Values and Wildcard Match are both standard dimension filter modes that control how users select or search for values in the filter card .
Correct Options:
A. Multiple Values (drop-down) –
This mode displays filter values in a drop-down list where users can select multiple checkboxes at once. It is one of the standard dimension filter card modes in Tableau .
C. Wildcard Match –
This mode provides a text box where users type characters (using * as a wildcard) to match and select values automatically, such as "tab*" to select all values starting with "tab" .
Incorrect Options:
B. Range of Values –
This is a measure filter mode, not a dimension filter mode. It displays values as a pair of sliders for selecting a numeric range, applicable only to measures .
D. At most –
This is a quantitative filter option for measures, allowing filtering on aggregated values (e.g., values ≤ a threshold). It is not a dimension filter card mode .
Reference:
Tableau Help – Filter Card Modes for Dimensions ; Tableau Filtering Documentation – Dimension vs. Measure Filters
Question 7Choose 3
From which three locations can a Tableau associate sort a visualization?
Choose three options.
Correct answer:
A. A header
C. An axis
D. A field label
Explanation:
Tableau allows users to sort data directly from the visualization through interactive elements. According to official Tableau documentation, single-click sorting options are available from an axis, a header, or a field label . These three locations provide quick access to sorting without navigating menus.
Correct Options:
A. A header –
Hovering over a header reveals a sort icon. Clicking it cycles through descending, ascending, and clearing the sort. The sort applies to the dimension values within that header .
C. An axis –
Hovering over a numerical axis displays a sort icon. This sorts the marks based on the measure values on that axis, applying to the innermost dimension when hierarchies are present .
D. A field label –
Field labels also provide a sort icon with alphabetical sorting as the default option, plus a menu to sort by other fields in the view .
Incorrect Options:
B. Tooltip on the Marks card –
Tooltips are for displaying additional information when hovering over marks. They do not provide sorting functionality .
E. The Worksheet menu –
While the Worksheet menu contains options like "Show Sort Controls," it is not a direct location to perform sorting. Sorting actions occur on the visualization elements themselves .
F. The Analysis menu –
The Analysis menu provides options for table calculations, totals, and forecasting. It does not serve as a direct sorting location for visualization elements .
Reference:
Tableau Help – Sort Data in a Visualization ("Quickly sort from an axis, header, or field label")
Question 8Choose 1
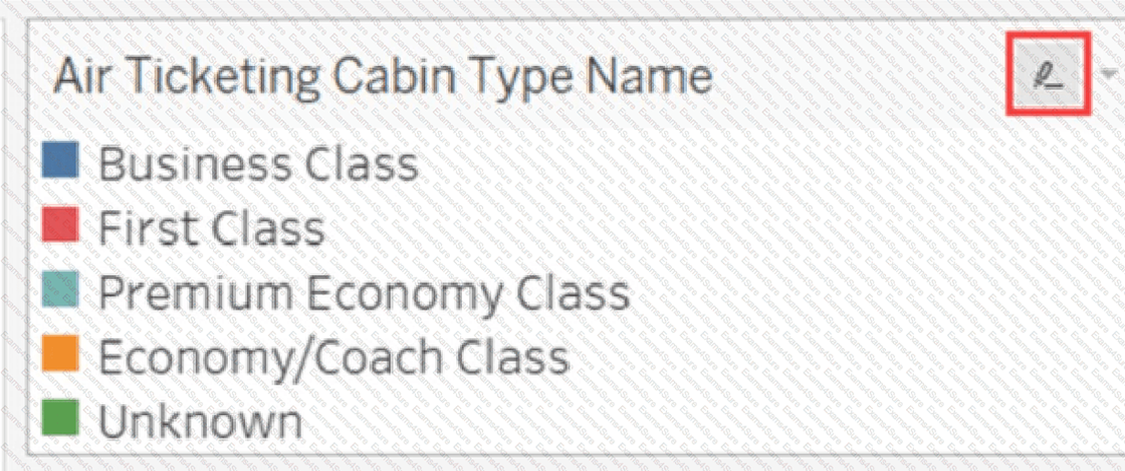
A Tableau associate has the following legend.
What occurs when the associate clicks the icon to the right of Air Ticketing Cabin Type Name?
Correct answer:
C. The highlighter toggles on or off.
Explanation:
The icon to the right of a legend item in Tableau is the highlight button. Clicking this icon toggles the highlighter on or off for that legend field. When activated, selecting a legend item will highlight the corresponding marks in the view while dimming all others, drawing focus to specific data points .
Correct Option:
C. The highlighter toggles on or off –
This is the correct answer. The highlight icon appears when you hover over a legend. Clicking it enables highlight mode, allowing you to click legend entries to spotlight matching marks. Clicking the icon again disables the highlighting action entirely .
Incorrect Options:
A. The Edit Colors dialog box opens –
The Edit Colors dialog is accessed by right-clicking a field or using the Edit Colors option from the legend's dropdown menu. It is not triggered by the highlight icon .
B. The filter options open –
Filter options are accessed through the filter card or by right-clicking a field and selecting "Show Filter." The highlight icon does not control filtering .
D. The legend toggles on or off –
The legend itself is hidden or shown via the Worksheet menu (Show/Hide Cards) or by right-clicking the legend and selecting "Hide Card." The highlight icon does not hide or show the legend .
Our timed 2026 Salesforce Tableau Desktop Foundations practice test mirrors the format, number of questions and time limit of the official exam.
The #1 challenge isn't just knowing the material, it's managing the clock. The simulation builds your speed and stamina, so you walk in knowing exactly what to expect.
Build exam stamina: stay focused and accurate for the entire duration.
Master time management: learn to pace yourself so you never have to rush.
A new test every time: a randomised set from the Salesforce Tableau Desktop Foundations - Analytics-101 question pool on every attempt.
Unlimited attempts: practice until you're 100% confident, not just once.
Exam Domains Covered in This Practice Test
This free Salesforce Certified Tableau Desktop Foundations practice test is
mapped to the official Salesforce exam blueprint. Every
question in this practice bank is tagged to one of the four weighted domains
below, so you can identify which areas need more study time before exam day.
Formatting views for presentation, color and mark formatting,
legends, dashboard creation, dashboard actions (filter, highlight, URL),
device-specific layouts, stories, exporting data, and publishing
workbooks.
Connecting to and Preparing Data
23%
Live connections vs. extracts, data source creation, .TDS and .TDSX
files, joins, unions, relationships, field properties (data types,
geographic roles, default properties), and data model management.
Understanding Tableau Concepts
15%
Dimensions vs. measures, discrete vs. continuous fields, discrete
date parts vs. continuous date values, default aggregations, and how
aggregated measures behave when dimensions are added to a view.
What You Will Learn by Practicing Here
Build every chart type on the exam — including bar, line,
scatterplot, maps, combined axis vs. dual axis, stacked bars, density maps,
and highlight tables.
Master calculations and table calculations — writing
calculated fields, using quick table calculations, and understanding
aggregations.
Configure filters correctly — distinguishing between
dimension filters, measure filters, date filters, and extract filters.
Design interactive dashboards — using filter actions,
highlight actions, and URL actions to create responsive user experiences.
Understand the data connection layer — knowing when to
use live connections vs. extracts, and how joins differ from relationships.
Apply Tableau vocabulary — dimensions vs. measures,
discrete vs. continuous, and how aggregation changes when dimensions are
added.
Format and share workbooks — exporting data, creating
stories, and publishing to Tableau Server or Cloud.
Domain weights reflect the official Salesforce Certified Tableau Desktop
Foundations exam guide. The exam contains 40 scored multiple-choice and
multiple-select questions plus up to 5 unscored questions, with a 70-minute
time limit. Passing score is 48% for the English version and 55% for the
Japanese version.