
Total 175 Questions
Last Updated On : 20-Sep-2026

You have the following calculated fields in a worksheet.
[Calc1] = DATEADD ('year', -1, TODAY ())
[Calc2] = DATETRUNC ( 'month' , DATEADD ('year', -1, TODAY ())
You want to calculate the month to date value of the prior year.
How should you complete the formula? (Drag the appropriate Options to the Answer Area and drop into the correct locations.)
Explanation
This formula creates a dynamic date range that automatically updates. It compares the [Order Date] against two calculated boundaries:
The Start Date: The first day of the same month, but one year ago (DATETRUNC('month', DATEADD('year', -1, TODAY()))).
The End Date: The same calendar day in the previous year (DATEADD('year', -1, TODAY())).
If an [Order Date] falls between or on these two dates, it is included in the prior year MTD calculation.
Correct Option Analysis
DATETRUNC('month', DATEADD('year', -1, TODAY()))
This correctly finds the start of the MTD period.
DATEADD('year', -1, TODAY()) first calculates the same date one year ago.
Wrapping it in DATETRUNC('month', ...) truncates that result to the first day of its month, giving you the starting boundary.
<= [Order Date] AND [Order Date] <=
This is the logical structure needed to define a date range.
It checks that the [Order Date] is on or after the start of the month (<=) and on or before the relative end date (<=).
DATEADD('year', -1, TODAY())
This correctly finds the end of the MTD period.
It simply calculates the exact date from one year ago, which serves as the relative "today" for the prior year period, establishing the upper boundary.
Incorrect Option Analysis
Using TODAY() instead of DATEADD('year', -1, TODAY()) for the end date:
This would calculate the current year's MTD, completely ignoring the "prior year" requirement. The end date must be shifted back a year to be relevant.
Using YEAR() or MONTH() functions alone:
A formula like YEAR([Order Date]) = YEAR(TODAY())-1 would select the entire previous year, not the specific month-to-date range. It lacks the precision to isolate a partial month up to a specific day.
Omitting the DATETRUNC for the start date:
Without DATETRUNC, the start date would be the exact day one year ago, not the first day of that month. This would result in an incorrect, shortened period starting from a random day within the month.
Reference
Tableau Help: Date Functions - The logic and syntax for DATEADD, DATETRUNC, and TODAY() are defined in the official Tableau documentation.
A Data Analyst is using containers on a dashboard. How should the analyst make sure multiple objects within a container are always taking up the same width or height, even if the container is resized?
A. Use the Layout tab to set the size of each object
B. Float the objects and manually adjust the size
C. Adjust the size of each object individually
D. Use the distribute evenly option
Explanation
In Tableau dashboards, the only way to guarantee that multiple objects inside a container (horizontal or vertical) always maintain identical width or height — no matter how the container or browser window is resized — is by using the “Distribute Evenly” feature. This locks the objects to share the container’s space equally and automatically.
✅ Correct Option: D. Use the distribute evenly option
Select all objects inside the container → right-click (or use the toolbar) → Distribute Evenly (horizontally for equal width, vertically for equal height). Tableau then forces every object to occupy exactly the same proportion of the container at all times, even during resizing or on different devices.
❌ Incorrect Option: A. Use the Layout tab to set the size of each object
The Layout tab lets you enter fixed pixel values, but fixed sizes break responsiveness. When the container shrinks or grows, objects with fixed sizes will overlap, leave gaps, or get cut off instead of resizing together.
❌ Incorrect Option: B. Float the objects and manually adjust the size
Floating objects ignore containers completely. They sit on an absolute layer and do not react to container resizing at all — you would have to manually reposition and resize everything again every time the dashboard size changes.
❌ Incorrect Option: C. Adjust the size of each object individually
Manually dragging or typing sizes gives inconsistent results. As soon as the container is resized (browser zoom, mobile view, etc.), objects keep their individual sizes and stop aligning properly — no automatic equal distribution occurs.
Reference:
Size and Lay Out Your Dashboard
You have a dashboard that contains a parameter named Start Date.
You need to create an extract from a Microsoft Excel file. The extract must be filtered based on Start Date.
What should you do?
A. Create a data source based on the Excel worksheet and create a calculated field based on Start Date. Add the calculated field to the extract filter.
B. Create a custom SOL query to define the data source and create a calculated field based on Start Date. Add the calculated field to the extract filter.
C. Create a custom SOL query that references Stan Date in the WHERE clause.
D. Create a data source based on the Excel worksheet and create a calculated field based on Start Date. From the Data pane, add the calculated field to the data source filter
Explanation
A Tableau Data Extract (a .hyper file) is a static snapshot of data. To filter this extract using a dynamic value like a parameter, you must define the filter criteria using a calculated field. This calculated field creates a boolean condition (e.g., [Date] >= [Start Date]). Adding this calculation to the Extract Filter and setting it to True permanently locks the extract to the records that satisfy the condition based on the parameter's value at the time of extraction.
✅ Correct Option: A (Create a data source based on the Excel worksheet and create a calculated field based on Start Date. Add the calculated field to the extract filter.)
The first step is establishing the connection to the Excel file to create a data source.
A calculated field, such as [Order Date] >= [Start Date], is necessary to compare the data field against the parameter value.
This calculated field is then applied in the Extract Filter dialog box, selected to filter for the True condition, ensuring only the qualifying records are included in the extract file.
❌ Incorrect Option: B (Create a custom SQL query to define the data source and create a calculated field based on Start Date. Add the calculated field to the extract filter.)
Microsoft Excel files, which are flat files, do not typically support the use of Custom SQL queries to define the data source connection in Tableau.
Custom SQL is a feature generally reserved for connections to relational databases (e.g., SQL Server, PostgreSQL) where a query language is required to define the data input.
❌ Incorrect Option: C (Create a custom SQL query that references Start Date in the WHERE clause.)
This approach fails for two reasons: Custom SQL is not applicable to Excel data sources, and Tableau parameters cannot be directly referenced by name within the text of a Custom SQL query for filtering in this context.
This method is only valid for some database connections via a Data Source Filter, but not for an Excel extract.
❌ Incorrect Option: D (Create a data source based on the Excel worksheet and create a calculated field based on Start Date. From the Data pane, add the calculated field to the data source filter)
While using a Data Source Filter (as opposed to an Extract Filter) achieves the exact same result (the filter is applied before the extract is saved), the most precise control for defining the contents of the extract file is specifically through the Extract Filter configuration dialog, which is the mechanism referenced in Option A.
🔗 Reference
Extract Your Data - Tableau Help
A Data Analyst is subscribed to several views. The analyst needs to unsubscribe from the views.
What should the analyst use?
A. The Shared with Me page
B. The Notifications area of Tableau Prep
C. The Data Source page of Tableau Desktop
D. The My Content area of Tableau Server / Cloud
Explanation
To manage and remove subscriptions, a user signs in to Tableau Server or Tableau Cloud and goes to My Content → Subscriptions. From there they can select the subscription(s), open the Actions menu and choose Unsubscribe, or follow the “Manage my subscriptions” link found at the bottom of a subscription email. Subscription controls are on the server/cloud side; neither Desktop nor Shared-with-Me provide subscription management tools.
Why 🟢 D is correct
My Content is the user-level area that lists a user’s workbooks, views, and subscription entries. It exposes the Subscriptions tab and the Actions menu where users can change schedule, subject, empty-view behavior, or remove (Unsubscribe) entries. This is the officially documented, supported way for an analyst to stop receiving scheduled view emails.
❌ Why the other options are incorrect
🔴 A. Shared with Me
This area only surfaces content that other users have shared with you. It’s for locating shared workbooks and views, not for managing personal subscriptions. Even if a subscribed view appears here, subscription settings aren’t editable from Shared with Me—subscription controls live in My Content or the subscription email link.
🔴 B. Notifications area of Tableau Prep
Tableau Prep’s notifications relate to flow runs and Prep Conductor events (flow success/failure), not scheduled workbook/view subscriptions. While Prep flow subscriptions can be managed in server/cloud flow pages, the general workbook/view subscriptions you receive by email are controlled in Tableau Server/Cloud (My Content or the email link).
🔴 C. Data Source page of Tableau Desktop
Tableau Desktop’s Data Source page is for connecting, shaping, and publishing data sources—it's not a place to view or remove subscription emails for dashboards. Subscription management requires signing into the server/cloud environment (My Content) or using the “Manage my subscriptions” link in subscription emails.
Summary
Unsubscribing from dashboard/view emails is done in Tableau Server or Tableau Cloud — specifically under My Content → Subscriptions or via the Manage my subscriptions link included in subscription emails. Shared pages, Prep notifications, and Desktop data source pages do not provide the subscription controls needed to unsubscribe.
🔗 Reference
Manage or unsubscribe from a subscription (Tableau Server).
Update or unsubscribe from a subscription (Tableau Cloud / Online).
A Data Analyst creates a parameter named Choose Region that contains values from a field named Region. The analyst wants users to be able to use the Choose Region parameter to interact with a chart by toggling between different regions.
What should the analyst do next?
A. Add Region to the Filters card.
B. Add the Choose Region parameter to the Pages card.
C. Set the Choose Region parameter to Single Value (list).
D. Add the [Region] = [Choose Region] formula to the Filters card.
Explanation
Creating a parameter alone does not make it interactive with the visualization. To filter the chart based on the parameter selection, you must create a calculated field that compares the [Region] field to the [Choose Region] parameter and then apply this calculation as a filter. This setup allows users to toggle between regions by selecting different values from the parameter control.
✅ Correct Option
D. Add the [Region] = [Choose Region] formula to the Filters card:
This is correct because it creates the necessary link between the parameter and the data. The calculated field [Region] = [Choose Region] returns TRUE for records matching the selected parameter value. When this field is added to the Filters shelf and set to TRUE, it dynamically filters the view to show only the region selected in the parameter control, enabling the intended interactivity.
❌ Incorrect Options
A. Add Region to the Filters card:
While this would filter the data, it creates a static filter based on manually selected region values. It does not connect to the parameter, so users cannot dynamically toggle between regions using the parameter control you created.
B. Add the Choose Region parameter to the Pages card:
The Pages shelf is used for creating animated visualizations that step through different values, not for simple toggle-based filtering. This would create a playback control for animating through regions rather than a simple selector to toggle between them.
C. Set the Choose Region parameter to Single Value (list):
Parameters are typically set to "Single Value (list)" by default when created. This configuration determines how users select values but does not actually connect the parameter to filter the data. This step alone doesn't make the chart interactive.
📝 Summary
To make a parameter control interactive, you must create a calculated field that references the parameter and then apply it as a filter. This creates the dynamic link between user selection and data display.
📚 Reference
Tableau Help: Create Parameters
You create a worksheet named Sales by Region and hide the tide of the worksheet. You print the worksheet as a PDF and notice that the worksheet title appears. You need to prevent the title from appearing when you print the worksheet as a PDF. Which settings should configure from the File menu in Tableau Desktop?
A. Page Setup
B. Print
C. Export As PowerPoint
D. Share
E. Export As Version
Explanation
The Page Setup dialog box in Tableau Desktop controls exactly which elements of a worksheet—including the title, caption, and legends—are included when you print to a physical printer or export to PDF. Even if you hide the title on the worksheet itself (for on-screen viewing), the print settings are configured separately in Page Setup, which defaults to including the title unless explicitly unchecked.
✅ Correct Option: A (Page Setup)
This option, found under the File menu, opens a dialog with a General tab.
The General tab contains checkboxes for elements like Title, View, Caption, and Legends.
To suppress the title in the PDF, you must uncheck the Title box within the Page Setup settings.
❌ Incorrect Option: B (Print)
The Print option (File > Print or File > Print to PDF) is used to execute the printing process after settings have been configured.
The Print dialog box controls the paper size, orientation, and print range (active sheet, entire workbook, etc.), but it does not contain the specific checkboxes to hide individual elements like the title.
❌ Incorrect Option: C (Export As PowerPoint)
This option is used for exporting the view as a slide to a Microsoft PowerPoint presentation.
It is not the correct command for controlling the visibility of elements during a PDF export, and its print-related configuration is entirely separate from the PDF print function.
❌ Incorrect Option: D (Share)
The Share option is typically used for publishing the workbook to Tableau Server or Tableau Cloud, or for sharing via email/other applications.
It has no direct control over the specific elements (like the title) included or excluded when creating a PDF file in Tableau Desktop.
❌ Incorrect Option: E (Export As Version)
Export As Version is used to save the workbook in an older Tableau Desktop file format (e.g., from 2024.1 to 2023.3) for compatibility with other users.
This feature is focused on file format management and has no function related to controlling the visibility of worksheet elements during printing or PDF export.
🔗 Reference
Printing Worksheets
You have a data source that contains the following columns.
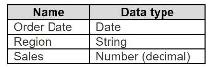
You want to filter regions based on the highest sales. Users must be able to specify the number of regions shown.
Which three actions should you perform in order?
(Place the three correct options in order. Use the arrows to move Options to Answer Area.
Use Answer Area arrows to re-order the options.)
Explanation
You have a data source with columns including Region and Sales. You want to filter regions based on the highest sales, and users must be able to specify the number of regions shown.
Goal: Create a dynamic Top N filter in Tableau.
Steps:
🟢 Step 1 – Create a parameter for “Number of Regions”
✅ Allows users to dynamically set how many regions they want to see (e.g., top 3, top 5).
✅ Parameters act as interactive controls in Tableau for filtering or calculations.
🟢 Step 2 – Create a Top N filter using Sales and the parameter
✅ Filters Region based on highest sales.
✅ The Top N calculation uses the parameter so the filter updates automatically when the parameter value changes.
🟢 Step 3 – Add the filter to the view
✅ Drag the Top N filter to the Filters shelf or apply to the view.
✅ Ensures users can interact with the parameter and dynamically change the number of regions displayed.
Incorrect Approaches Explained:
🔴 Hardcoding the Top N value (e.g., 5) – ❌ Does not allow user interaction.
🔴 Filtering by a static calculated field without using a parameter – ❌ Users cannot control the number of regions dynamically.
🔴 Sorting the view without a Top N filter – ❌ Sorting alone does not limit the number of regions shown.
Summary:
To create a dynamic Top N filter in Tableau, first create a parameter for the number of regions, then use it in a Top N filter based on Sales, and finally add the filter to the view for user interaction. This allows users to see the top regions based on sales and adjust the number displayed.
Reference:
Tableau Official Docs: Top N and Conditional Filters
Tableau Official Docs:
Parameters
A Data Analyst needs to calculate the percent of regional sales that each state contributes to. As a first step, the analyst needs to calculate total sales per region.
Which calculation should the analyst use to do this?
A. {FIXED [Region]: SUM([Sales])}
B. [FIXED [Region]: TOTAL([Sales])]
C. {FIXED [State]: SUM([Sales])}
D. {FIXED [State], [Region]: SUM([Sales])}
Explanation
To calculate each state’s percentage of its region’s total sales, the analyst must first create a calculation that returns the same regional total on every state row. This allows a simple division: State Sales ÷ Region Total. Only a FIXED LOD expression that is scoped exactly to Region (and ignores State) can deliver that consistent regional value across the entire dataset.
Correct Option
✅ A. {FIXED [Region]: SUM([Sales])}
This is the perfect solution. The FIXED keyword tells Tableau to compute the sum of Sales at the Region level only, ignoring any finer dimensions in the view (like State). The result is a single total for the entire region that appears on every state row belonging to that region, making the subsequent percent calculation accurate and straightforward.
Incorrect Options
❌ B. [FIXED [Region]: TOTAL([Sales])]
This syntax is completely invalid and will throw an error immediately. TOTAL() is a table calculation that requires compute-using settings and cannot be placed inside a FIXED LOD expression. Even if someone tries to force it, Tableau will reject the calculation before it ever ever runs.
❌ C. {FIXED [State]: SUM([Sales])}
Although this is valid syntax, it defeats the purpose. By fixing on State, the calculation simply returns the regular SUM([Sales]) for each state—exactly what you already get without any LOD. It provides no regional total at all, so dividing state sales by this value would always yield 100% and make the percentage-of-region analysis impossible.
❌ D. {FIXED [State], [Region]: SUM([Sales])}
This LOD is scoped to the combination of State and Region, meaning it still calculates sales at the individual state level (just with Region as extra context). The result is identical to normal SUM([Sales]) when both dimensions are present, so it never produces a single region-wide total. Using this in the denominator would again return 100% for every state.
Reference
FIXED Level of Detail Expressions
How Level of Detail Expressions Work in Tableau
You publish a dashboard that uses an attract. The extract refreshes every Monday at 10:00.
You need to ensure that the extract also refreshes on the last day of the month at 18:00.
What should you do?
A. From Tableau Desktop, open the Publish Workbook dialog box and configure the schedule.
B. From Tableau Server select the workbook select Refresh Extracts and then add a new extract refresh
C. From Tableau Server. select Schedules find the schedule of the extract, and change the frequency to the Last day of the month
D. From Tableau Server. select Schedules and change the priority of the existing schedule
Explanation
To set a second, specific refresh time for an existing extract on Tableau Server or Tableau Cloud, you must add a new refresh schedule to the published data source or workbook. Each extract can be linked to multiple, independent schedules, allowing for flexible refresh timings like weekly and end-of-month. The "Refresh Extracts" option for the workbook allows the analyst to manage all associated schedules without disrupting the already existing Monday schedule.
Options Analysis
✔️ Correct Option: [C] From Tableau Server, select the workbook, select Refresh Extracts, and then add a new extract refresh.
In the Tableau Server or Cloud interface, when you select a published workbook or data source, the Refresh Extracts option lets you view and manage its assigned schedules. To add the required last day of the month at 18:00 refresh without affecting the existing Monday refresh, you must explicitly add a new schedule that targets the same extract. This is the only way to assign multiple, different schedules.
❌ Incorrect Option: [A] From Tableau Server, select Schedules, find the schedule of the extract, and change the frequency to the last day of the month.
If you were to select the existing schedule (Monday at 10:00) and change its frequency, you would overwrite the Monday refresh. This action would ensure the extract refreshes on the last day of the month, but it would stop the necessary weekly Monday refresh, failing to meet the requirement of having both schedules running.
❌ Incorrect Option: [B] From Tableau Server, select Schedules, and change the priority of the existing schedule.
Changing the priority of an extract refresh schedule affects when it runs relative to other tasks scheduled for the same time, but it does not change the frequency or timing. Adjusting the priority would not add the required last-day-of-the-month refresh and is completely irrelevant to setting a new recurring time.
❌ Incorrect Option: [D] From Tableau Desktop, open the Publish Workbook dialog box and configure the schedule.
While the initial schedule is set during publishing from Tableau Desktop, the management and addition of subsequent schedules must be done directly on Tableau Server/Cloud after the workbook or data source has been published. Re-publishing just to change the schedule is inefficient, and the preferred method for managing schedules is always via the web interface.
Reference 🔗
Tableau Help: Extract Refresh Schedules
A colleague provides you with access to a folder that contains the following files:
• Sates.csv
• Bookl.twb
• Sates.hyper
• Export.mdb
Which He contains an extract?
A. Export mdb
B. Book1.twb
C. Sales.hyper
D. Sales.csv
Explanation
A Tableau extract is a highly compressed, optimized snapshot of data stored locally on your machine. This local copy, which uses Tableau's proprietary high-performance engine, improves visualization speed, reduces the load on the original database, and allows for offline work. Since Tableau version 10.5, the modern file extension for a data extract is .hyper (replacing the older .tde extension).
✅ Correct Option: C. Sales.hyper
The .hyper extension specifically denotes a Tableau Data Extract file. This file type contains the actual data from the source, compressed and stored in a columnar format that is highly optimized for fast querying within Tableau. It functions as an independent, local copy of the data, which is the definition of an extract.
❌ Incorrect Option: A. Export.mdb
The .mdb extension is associated with a Microsoft Access Database file. While Tableau can connect to this file type to access data, the .mdb file itself is the original data source, not a Tableau-created or optimized data extract. It is a proprietary database format separate from Tableau's extract technology.
❌ Incorrect Option: B. Book1.twb
The .twb (Tableau Workbook) extension contains the design and logic of your visualization, such as worksheets, dashboards, and connection information. Crucially, a standard .twb file does not contain the actual underlying data. It requires live access to the original data source (like the .csv or a database).
❌ Incorrect Option: D. Sales.csv
A .csv (Comma Separated Values) file is a plain-text file containing raw data, which serves as a simple data source. Tableau can connect to this file type, but the file itself is the original source of data, not a compressed, optimized Tableau extract file.
🌐 Reference
Tableau File Types and Folders
| Page 3 out of 18 Pages |
| 123456 |
| Salesforce-Tableau-Data-Analyst Practice Test Home |
Our new timed 2026 Salesforce-Tableau-Data-Analyst practice test mirrors the exact format, number of questions, and time limit of the official exam.
The #1 challenge isn't just knowing the material; it's managing the clock. Our new simulation builds your speed and stamina.
You've studied the concepts. You've learned the material. But are you truly prepared for the pressure of the real Salesforce Certified Tableau Data Analyst exam?
We've launched a brand-new, timed Salesforce-Tableau-Data-Analyst practice exam that perfectly mirrors the official exam:
✅ Same Number of Questions
✅ Same Time Limit
✅ Same Exam Feel
✅ Unique Exam Every Time
This isn't just another Salesforce-Tableau-Data-Analyst practice questions bank. It's your ultimate preparation engine.
Enroll now and gain the unbeatable advantage of:

Copyright © - All Rights Reserved